
Signal of the week: The amount of Bitcoin sitting at a loss just exceeded the amount in profit for the first time since November 2022. In previous cycles, Bitcoin hit its cycle bottom within three months of this crossover. In some cases, it happened right at the moment it occurred.
Bitcoin briefly touched $58,000, but then experienced a price recovery, supported by LTH accumulation and fading selling pressure. The more important development is that the picture is beginning to look less like a market falling apart and more like one approaching a turning point.
About the Bitcoin Impact Index
The Bitcoin Impact Index measures which groups of Bitcoin holders are under financial stress, how severe that stress is, and whether it’s severe enough to shake confidence in the market’s direction. It combines on-chain holder behaviour, ETF and derivatives activity, and exchange-level liquidity flows into a single weekly score between 0 and 100. Unlike sentiment indicators, it deliberately excludes social media and volume data to focus on what participants are doing rather than what they are saying.
Score bands:
- Normal Rotation (0–24) — routine profit-taking, no structural shift
- Elevated Repositioning (25–49) — specific groups shifting positions, pressure uneven across the market
- High Impact (50–74) — broad stress across multiple holder groups and institutional flows simultaneously
- Critical Impact (75–100) — full capitulation: LTH losses, large ETF outflows, major liquidations, and heavy exchange inflows at once
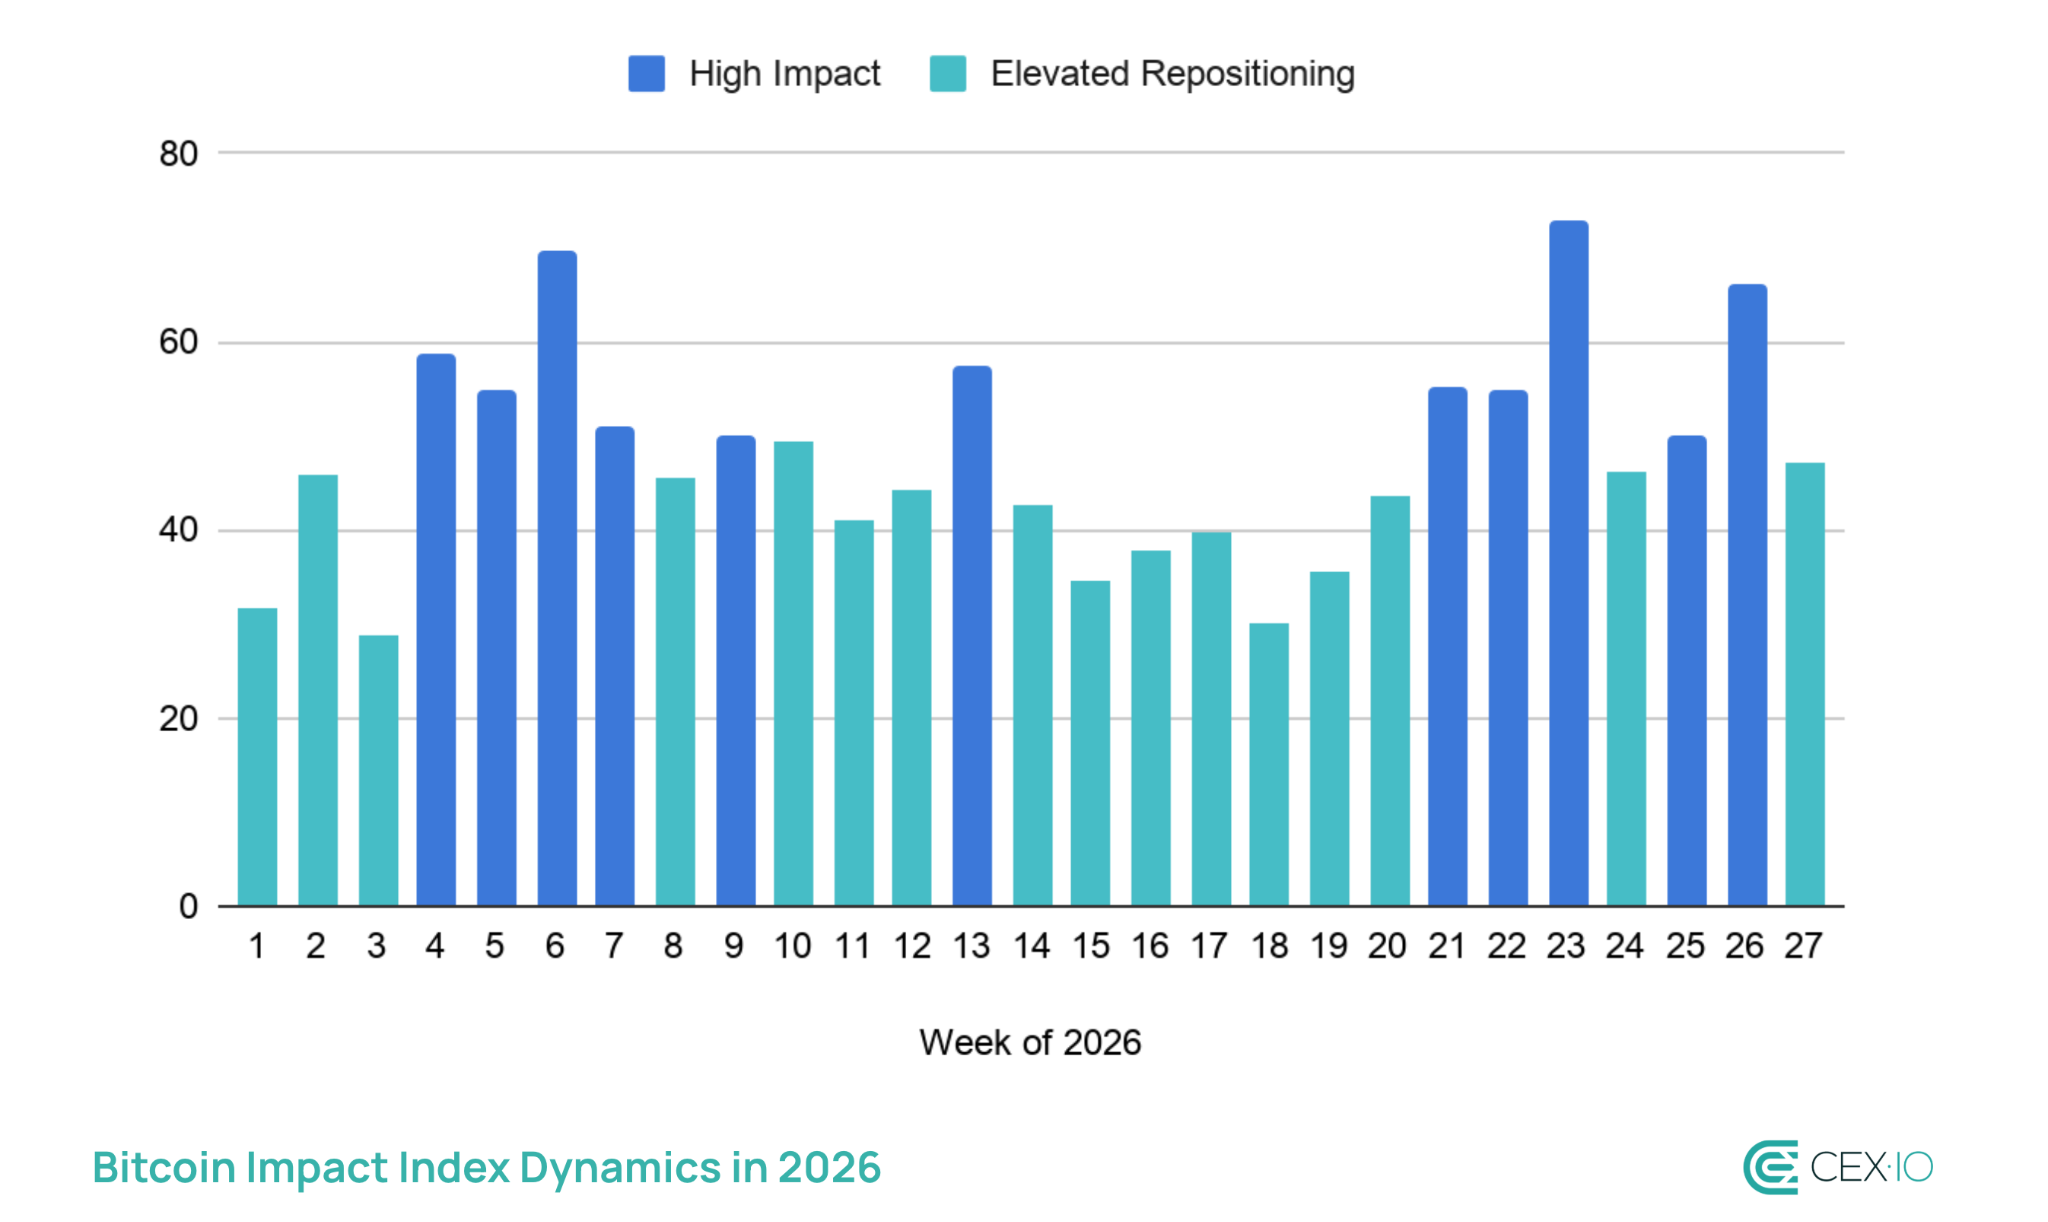
Week 27 (June 29 – July 5): BII 47.0 — Elevated Repositioning
Positive signals: long-term holders showed one of their most dramatic improvements in 2026
LTH SOPR, a metric that measures whether long-term Bitcoin holders are selling at a profit or a loss, recovered from 0.676 to 0.939 in a single week, showing the largest positive weekly move since mid-March. This kind of sharp, rapid recovery has historically been associated with the early stages of a trend reversal.
Total LTH supply also decreased by roughly 10,000 BTC this week. But unlike last week’s sell-into-weakness behavior, this reduction occurred as Bitcoin’s price recovered. Historically, this kind of transition from LTH to STH appeared in the early stages of major Bitcoin rallies and typically signaled renewed accumulation. However, it’s still too early to call it a trend. A few more weeks of similar behavior would be needed for confirmation, but the direction has clearly shifted.
Older dormant coins also began moving again. Revived supply aged six months and older rose to its highest level since February, and the realised value of that revived supply hit its highest level since December 2025. In plain terms: holders who had been sitting completely inactive through the bear market are beginning to engage with the market again. That is also a sign of broader participation that typically accompanies recovery phases.
Short-term holders improved significantly as well, with realized P/L recovering from –0.832 to –0.038, nearly back to breakeven. Recent buyers who were deeply underwater just one week ago now experience much less stress.
Negative signals: stress is easing but not gone
ETF outflows continued for an eighth consecutive week at -$527 million. While that is a notable improvement from last week, the streak itself matters, indicating a sustained withdrawal of exposure. Stablecoin outflows also deepened slightly to -$147 million daily average, meaning fresh buying capital is still leaving rather than building up.
Long liquidations remained elevated at 73.5% of total liquidations, though total liquidation volume dropped to $128 million from $189 million 7-day SMA. The leverage flush has not yet fully completed.
Mixed signals: Bitcoin crossed the line that has historically marked the final stage of bear markets
More Bitcoin is now sitting at an unrealised loss than in profit — 10.1 million coins underwater versus 9.9 million in profit. This is the first time this crossover occurred since the week of the FTX collapse in November 2022. Historically, the cycle bottom occurred within less than 3 months since this signal. In some cases it bottomed almost immediately.
That does not mean the bottom is in now. The same metrics were approached gradually in both previous cycles, and Bitcoin made lower lows after touching this zone in 2014, 2018, and 2022 before finally bottoming out. But from a cycle-positioning perspective, the data is placing this moment in a historically specific context: not the middle of a bear market, but the final stage.
What could happen next
The bearish MACD crossover that was threatening on the daily chart failed to materialise, and both RSI and MACD are now showing bullish divergences across daily and weekly timeframes. On-Balance Volume is also showing similar divergences, suggesting improvements in the underlying volume profile consistent with broader recovery phases. This is a typical setup of weakening downward pressure, which could transition to broader upward movement.
The 200-week SMA near $62,500 is the key test right now, and Bitcoin is already challenging it. If bulls can push through and maintain above it, the next major target is the short-term holder cost basis near $68,000. Crossing that level would return the majority of recent buyers to profit and remove a persistent source of overhead selling pressure.
If the 200-week SMA holds as resistance rather than support, $58,000 and then $54,000 remain the levels to watch on the downside. The $54,000 zone is near Bitcoin’s realised price and the aggregate cost basis of all circulating supply, which has historically only been broken very close to final bear market bottoms.
oiled spring” reading is right, or whether the deteriorating LTH SOPR is the more important signal after all.
The web content provided by CEX.IO is for educational purposes only. The information and tools provided neither are, nor should be construed as, an offer, or a solicitation of an offer, or a recommendation, to buy, sell or hold any digital asset or to open a particular account or engage in any specific investment strategy. Digital asset markets are highly volatile and can lead to loss of funds.
The availability of the products, features, and services on the CEX.IO platform is subject to jurisdictional limitations. To understand what products and services are available in your region, please see our list of supported countries and territories. This page includes additional links to information about individual products, and their accessibility.

You can get bonuses upto $100 FREE BONUS when you:
💰 Install these recommended apps:
💲 SocialGood - 100% Crypto Back on Everyday Shopping
💲 xPortal - The DeFi For The Next Billion
💲 CryptoTab Browser - Lightweight, fast, and ready to mine!
💰 Register on these recommended exchanges:
🟡 Binance🟡 Bitfinex🟡 Bitmart🟡 Bittrex🟡 Bitget
🟡 CoinEx🟡 Crypto.com🟡 Gate.io🟡 Huobi🟡 Kucoin.




















Comments