Bitcoin is entering a decisive phase as the market faces renewed selling pressure and short-term sentiment turns cautious. After weeks of volatility and failed attempts to hold above key resistance zones, investors are now watching closely to see whether BTC can stabilize and defend support as macro and liquidity factors continue to shift. Yet beneath the surface, new on-chain data points to a strong foundation forming — one that may be quietly setting the stage for the next major leg higher.
According to fresh insights, Binance’s netflow data for October 2025 delivered one of the strongest bullish signals of this cycle. The exchange saw a record-breaking $7 billion net inflow, signaling a significant wave of capital preparing to enter the market. Even more importantly, the composition of this flow suggests a structurally bullish setup: the majority of incoming liquidity came from stablecoins, representing billions in sidelined buying power.
At the same time, both Bitcoin and Ethereum registered net outflows from Binance — a sign that long-term holders are withdrawing funds to self-custody rather than preparing to sell. This divergence between incoming liquidity and decreased sell-side supply is historically associated with early accumulation phases and heightened bullish potential. In other words, while price action appears uncertain, the underlying capital rotation suggests Bitcoin may be gearing up for a decisive move.
Stablecoin Surge + Bitcoin Outflows Create a Powder-Keg Setup for Next Move
According to new data shared by CryptoQuant, one of the most compelling trends in recent months has been the scale and composition of capital flows into Binance. Over the past 30 days, the exchange recorded a net inflow of more than $5 billion in Tether (USDT) and an additional $2 billion in USD Coin (USDC). This is not ordinary liquidity — it is pure “dry powder”, capital deliberately positioned on the sidelines and waiting for favorable entry points. Such aggressive stablecoin inflows historically precede major market expansions, signaling that deep liquidity is preparing to re-enter risk assets.

What makes this dynamic even more significant is that it is occurring alongside persistent outflows of crypto assets. Binance saw approximately $1.5 billion in Bitcoin and $500 million in Ethereum move off the platform in the same period — a classic hallmark of long-term accumulation. Investors withdrawing BTC and ETH to self-custody drastically reduces available sell-side supply, tightening the float and amplifying future price impact when demand accelerates.
The combination is powerful: surging dollar liquidity + shrinking exchange balances = bullish supply-demand imbalance building beneath the surface. Additionally, flows into the “Other Altcoins” category have picked up noticeably, hinting that capital is beginning to position beyond majors — often an early signal of increasing risk appetite and the initial stages of an altcoin rotation.
While price action remains choppy and sentiment cautious, this liquidity posture is historically aligned with pre-breakout market structure, not late-cycle exhaustion. Traders should watch closely for signs of stablecoin rotation into BTC and ETH; once that ignition point arrives, the resulting flow could mark the beginning of the market’s next major rally phase.
BTC Retests Key Support as Market Awaits Direction
Bitcoin continues to trade under pressure, currently hovering near the $107,000–$108,000 support zone after failing to reclaim the $110,000 level. The chart shows price struggling below the short- and medium-term moving averages, signaling weakening momentum in the near term. The repeated rejections near $117,500, a major resistance and former range high, reinforce this level as a critical battleground for bulls. Until BTC reclaims and holds above this threshold, upside conviction remains limited.
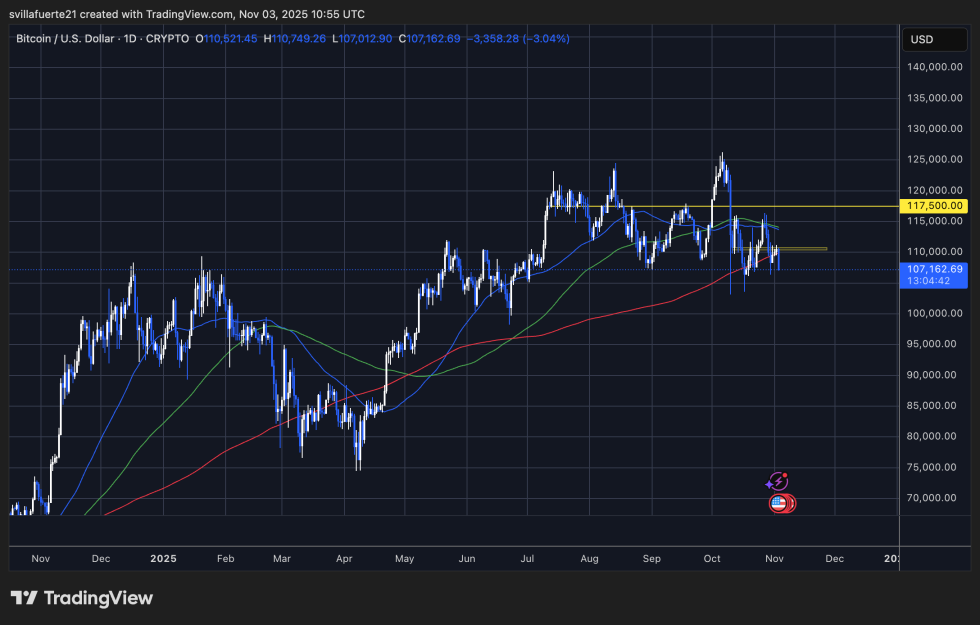
Price is also interacting with the 200-day moving average, which has acted as a dynamic support during this cycle. A confirmed breakdown below this moving average could open the door toward deeper liquidity pockets around $103,000–$105,000, where prior demand emerged during the post-October crash recovery.
Still, the structure has not decisively shifted bearish. Bitcoin remains within a broad consolidation range that began in late summer, and despite volatility, sellers have yet to break the market’s higher-timeframe structure. As long as BTC holds above the $100K–$105K region, bulls maintain a defensive position.
With macro catalysts in play and large capital inflows sitting on the sidelines, the coming sessions may determine whether this drawdown becomes a launchpad — or the market heads for another liquidity sweep before trending higher.
Featured image from ChatGPT, chart from TradingView.com

You can get bonuses upto $100 FREE BONUS when you:
💰 Install these recommended apps:
💲 SocialGood - 100% Crypto Back on Everyday Shopping
💲 xPortal - The DeFi For The Next Billion
💲 CryptoTab Browser - Lightweight, fast, and ready to mine!
💰 Register on these recommended exchanges:
🟡 Binance🟡 Bitfinex🟡 Bitmart🟡 Bittrex🟡 Bitget
🟡 CoinEx🟡 Crypto.com🟡 Gate.io🟡 Huobi🟡 Kucoin.


Comments